有时候,我们需要知道从哪开始有了分支和标签,同时想知道这条支路是单独的分支还是树型结构。如果需要你可以使用 → 。
这个版本历史分析图能够显示分支/标签从什么地方开始创建,以及什么时候删除。
重要
为了生成图示,TortoiseSVN 必须从版本库根目录中提取所有的日志信息。无需言明,对于拥有几千个修订版本的版本库来说得需要花上数分钟时间,这取决于服务器速度,网络带宽等。如果您尝试对像超过有 500,000 个修改版本的 Apache 之类的项目来进行此操作,您可能得等待一些时候。
好消息是,如果你正使用日志缓存,你只需遇到一次这种延迟。之后,日志数据被保存到本地。日志缓存在 TortoiseSVN 设置中可被启用。
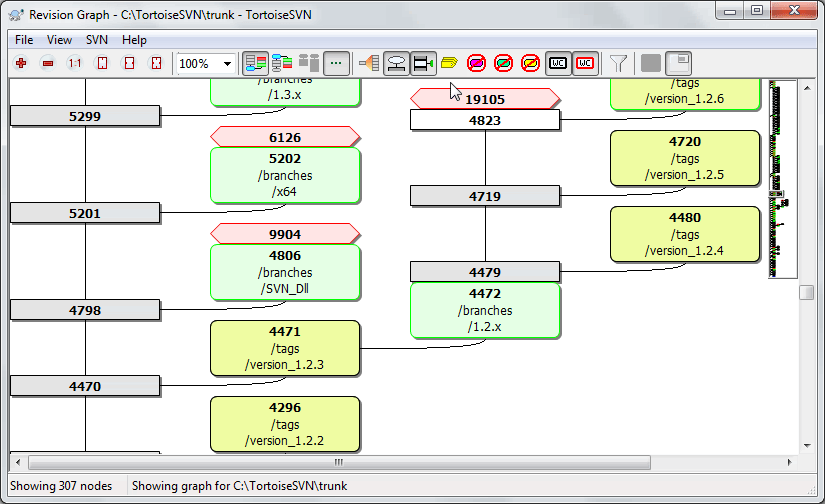
每个版本图节点代表版本库中的一个修订版本,在那儿你可以查看到树状的变化。不同类型的节点可通过形状和颜色来区分。形状是固定的,但颜色可以使用 →
- 新增或复制的项目
已添加或通过复制另一个文件/文件夹而创建的项目使用一个圆角矩形来显示。默认颜色为绿色。标签和主干都被视为一个特殊的情况并使用不同的色调,这取决于 → 。
- 已删除的节点
已删除的项目,例如一个不再需要的分支,显示为一个八边形 (切角的矩形)。默认颜色为红色。
- 重命名的项目
重命名的项目也使用一个八边形,但默认颜色是蓝色的。
- 分支最新版本
图示通常只限于显示分支点,但通常也可用于查看每个分支各自的 HEAD 版本。如果您选择 显示 HEAD 版本,每个 HEAD 版本节点将显示为一个椭圆形。请注意,这里的 HEAD 是指在本路径上所提交的最新版本,而不是版本库的 HEAD 版本。
- 当前工作副本的版本
如果您从工作副本中调用版本图,你可以使用 显示工作副本的版本号 在图示上选择显示当前版本号,这使用了一个粗体边框来标记当前版本节点。
- 已修改的工作副本
如果您从工作副本中调用版本图,你可以使用 显示工作副本的本地更新 选择显示附加节点来表明你修改过的工作副本,附加节点默认有一个红色的粗体边框。
- 一般的文件/文件夹
其他一般的文件用plain rectangle标示。
来设置。
注意默认情况下图示只显示被添加、复制或删除的项目点。非常状况下显示每一个项目版本将生成一个非常巨大的图示。如果你真的想看到 所有 发生更改的版本,在 查看 菜单和工具栏上的某个选项可以满足您的要求。
默认视图 (分组关闭) 的节点置放主要是让其垂直位置按照严格的版本顺序排列,所以你会对已完成项目的顺序产生一个视觉提示。同列中两个节点的顺序是非常明显的。当两个节点处于相邻列时偏移量会更小,因为不必防止节点相互重叠,因此顺序并不太明显。这种优化是必要的,可以将复杂的图示保持到一个合理的规模。请注意,这种排序使用了 较老 的一边的节点 边缘 作为参照,也就是当用底部最老的节点显示图示时的节点底部边缘。这种参考的边缘是很显著的,因为节点的形状并不都是相同的高度。
因为版本图经常很复杂,所以有很多方法剪裁视图。你可以在视图菜单或工具栏找到它们。
- 分组分支
默认行为 (分组关闭) 让所有的行严格按照版本号进行排序。结果,只有稀少的提交而有较长寿命的分支仅仅为少数的变化而占据一整列,并且版本图变得非常宽广。
This mode groups changes by branch, so that there is no global revision ordering: Consecutive revisions on a branch will be shown in (often) consecutive lines. Sub-branches, however, are arranged in such a way that later branches will be shown in the same column above earlier branches to keep the graph slim. As a result, a given row may contain changes from different revisions.
- 最老的在顶部
正常情况下,在图形底部显示最老的版本,版本树向上生长。使用这个选项,版本树从顶部向下生长。
- 顶部对齐树
当一个版本图形被拆分成几个较小的树结构时,这些树结构既可能按自然的修订版本顺序显示,也可能对齐于窗口的底部,这取决于您是否使用了 Group Branches 选项。使用该选项可让所有树结构自顶向下延伸。
- 减少交叉行
This option is normally enabled and avoids showing the graph with a lot of confused crossing lines. However this may also make the layout columns appear in less logical places, for example in a diagonal line rather than a column, and the graph may require a larger area to draw. If this is a problem you can disable the option from the View menu.
- 差异路径名称
长路径名称会占据大量空间并且让节点框变得非常大。使用此选项可以只显示路径的变化部分,而用小数点来代替共同部分。例如,如果您从
/trunk/doc/html创建了一个分支/branches/1.2.x/doc/html,可以用简洁形式将该分支显示为/branches/1.2.x/..,因为最后两级doc和html并无变化。- 显示所有版本
这会如你所愿并显示每一个发生更改(您正在绘制的树结构中)的修订版本。如果历史版本繁长,这可能会生成一个相当巨大的图形。
- 显示最新版本
它确保每个分支的最新版本永远在图中显示。
- 精确复制源
当创建一个分支/标签时,默认行为是将分支显示为取自最后一个发生更改的节点。严格地讲,这并不准确。因为分支往往创建自当前 HEAD 而非某个特定的修订版本。因此,有可能显示更为正确的(但用处不大)用来创建副本的修订版本。请注意,此修订版本可能比源分支的 HEAD 版本更新。
- 折叠标签
When a project has many tags, showing every tag as a separate node on the graph takes a lot of space and obscures the more interesting development branch structure. At the same time you may need to be able to access the tag content easily so that you can compare revisions. This option hides the nodes for tags and shows them instead in the tooltip for the node that they were copied from. A tag icon on the right side of the source node indicates that tags were made. This greatly simplifies the view.
Note that if a tag is itself used as the source for a copy, perhaps a new branch based on a tag, then that tag will be shown as a separate node rather than folded.
- 隐藏已删除的路径
隐藏掉已经不在最新版本的路径,例如已经删除的分支。
If you have selected the Fold tags option then a deleted branch from which tags were taken will still be shown, otherwise the tags would disappear too. The last revision that was tagged will be shown in the colour used for deleted nodes instead of showing a separate deletion revision.
If you select the Hide tags option then these branches will disappear again as they are not needed to show the tags.
- Hide unused branches
隐藏那些没有更改提交到相应文件或子文件夹中的分支。这并不一定表示该分支不被使用,仅表示它的这部分没有发生更改。
- 显示最新版本
在图形上标记修订版本,其对应于您抓取图形而得到的该项目的更新修订版本。如果您刚刚更新,这将会是 HEAD。但如果有其他人自您上次更新后提交了更改,您的工作副本可能会处在一些修订版本之后。该节点用粗边框来标记。
- 显示工作拷贝的修改
如果您的工作副本包含本地更改,此选项会将它绘制为单独的椭圆形节点,其被链接回您的工作副本最后更新至的节点。默认的边框颜色为红色。您可能需要使用 F5 刷新图形来捕获最近的更改。
- 过滤器
有时修订版本图形显示的修订版本比您想看的还要多。此选项打开一个对话框,可允许您限制修订版本的显示范围,并通过名称隐藏特定的路径。
If you hide a particular path and that node has child nodes, the children will be shown as a separate tree. If you want to hide all children as well, use the Remove the whole subtree(s) checkbox.
- 修剪树
当版本图中包含不同的版本树时,在背景上用不同的颜色区分是很有用的。
- 显示概述
将整个图形显示为小图片,当前视图窗口如同可以拖动的矩形。这可以使您更轻松地导航图形。请注意,对于相当大的图形,概览可能会由于极端的缩放系数而变得无用,并且在这种情况下会因此不被显示。
概览窗口可以使遍历大图更容易。它在小窗口中显示整个图形,高亮显示当前详细显示的部分。你可以通过拖曳高亮区域来改变当前详细显示的部分。
任何时候只要鼠标在版本框上滑过,都会显示该版本的日期、作者和备注信息。
选择两个版本(用ctrl+左击),你可以在右键菜单下查看这两个版本的差异。你可以在分支的起始点查看差异,但一般你会在一个分支的结束点来查看,比如,在最新版本。
你可以用查看单一差异文件的方式来查看差异,它在单一的文件中显示差异。如果你选 → 所有修改过的文件都会呈现在列表中。双击一个文件名可以返回文件版本号和他们差异。
如果右击一个版本你可以使用 → 来查看它的历史。
您也可以将所选修订版本的更改合并到不同的工作副本。可以通过文件夹选择对话框来确定合并到哪一个工作副本中,但是此操作没有确认对话框,也没有尝试测试合并的机会。合并到未修改的工作副本是一个好主意,这样当其行不通时您还可以恢复这些更改!当您想要将所选版本从一个分支合并到另一个分支时,这个功能很有用。
学习怎样看版本关系图
初次使用的用户可能会被修订版本图形不符合用户心理模式的显示所惊倒。比如,如果一个修订版本更改了一个文件或文件夹的多个副本或分支,然后这单个修订版本将会有多个节点。建议您从工具栏最左边的选项开始并一步步自定义图形直到它慢慢接近您的心理模式为止。
所有过滤选项都会尝试尽可能漏掉小信息。这可能会导致某些节点更改它们的颜色等。只要结果不符合预期,就应撤销上次过滤操作并尝试理解特定修订版本或分支的特别之处。在大多数情况下,过滤操作的最初预期结果既不准确也可能误导。
如果你想再次检查服务器是否有新的消息,可以使用 F5 键来刷新视图。如果使用日志缓存(默认启用),这将会检查版本库是否有新的提交并且只获取新的。如果日志缓存处于离线模式,这将会尝试回到在线模式。
如果您正在使用日志缓存并且认为消息内容或作者可能已更改,您应该使用日志对话框来刷新所需消息。由于修订版本图形起于版本库根目录,我们将不得不使整个日志缓存失效,而重新填满它可能会花上非常长的时间。
一个大的树结构可能难以导航,有时您会想隐藏其中一部分,或者把它拆分成更小的树结构集合。如果您将鼠标悬停于节点链接进入或离开节点的地方,您将会看到一个或更多的弹出式按钮来允许您这样做。

在减号上单击收起关联子树。

点击加号按钮来展开折叠的树结构。当一个树结构已经折叠时,此按钮将保持可见以表明已隐藏的子树。

点击十字按钮来拆开所连接的子树,并在图形上将其显示为单独的树。

点击圆形按钮以重新连接一个拆开的树。当一个树已被拆离时,此按钮将保持可见以表明有一个单独的子树。
点击图形背景以获取主上下文菜单,它可提供选项来 全部展开 和 全部拼合。如果没有分支被折叠或拆开,该上下文菜单将不会被显示。