Ada kalanya Anda perlu mengetahui darimana cabang dan tag diambil dari trunk, dan cara ideal untuk melihat informasi semacam ini adalah grafik atau struktur susunan. Itulah saatnya Anda menggunakan →
Perintah ini menganalisa histori revisi dan mencoba untuk membuat susunan memperlihatkan titik dimana copy diambil, dan ketika cabang/tag dihapus.
Penting
In order to generate the graph, TortoiseSVN must fetch all log messages from the repository root. Needless to say this can take several minutes even with a repository of a few thousand revisions, depending on server speed, network bandwidth, etc. If you try this with something like the Apache project which currently has over 500,000 revisions you could be waiting for some time.
The good news is that if you are using log caching, you only have to suffer this delay once. After that, log data is held locally. Log caching is enabled in TortoiseSVN's settings.
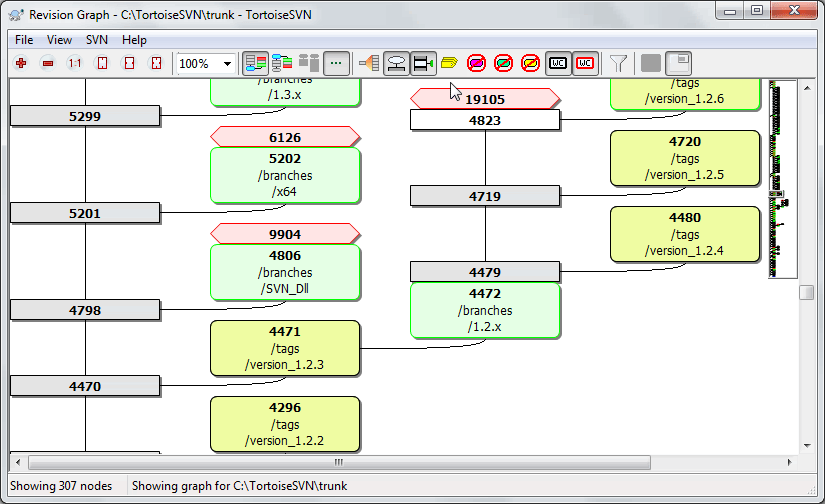
Each revision graph node represents a revision in the repository where something changed in the tree you are looking at. Different types of node can be distinguished by shape and colour. The shapes are fixed, but colours can be set using →
- Added or copied items
Items which have been added, or created by copying another file/folder are shown using a rounded rectangle. The default colour is green. Tags and trunks are treated as a special case and use a different shade, depending on the → .
- Deleted items
Deleted items e.g. a branch which is no longer required, are shown using an octagon (rectangle with corners cut off). The default colour is red.
- Renamed items
Renamed items are also shown using an octagon, but the default colour is blue.
- Revisi tip cabang
The graph is normally restricted to showing branch points, but it is often useful to be able to see the respective HEAD revision for each branch too. If you select Show HEAD revisions, each HEAD revision nodes will be shown as an ellipse. Note that HEAD here refers to the last revision committed on that path, not to the HEAD revision of the repository.
- Working copy revision
If you invoked the revision graph from a working copy, you can opt to show the BASE revision on the graph using Show WC revision, which marks the BASE node with a bold outline.
- Modified working copy
If you invoked the revision graph from a working copy, you can opt to show an additional node representing your modified working copy using Show WC modifications. This is an elliptical node with a bold outline in red by default.
- Normal item
Semua item lain ditampilkan menggunakan kotak biasa.
Note that by default the graph only shows the points at which items were added, copied or deleted. Showing every revision of a project will generate a very large graph for non-trivial cases. If you really want to see all revisions where changes were made, there is an option to do this in the View menu and on the toolbar.
The default view (grouping off) places the nodes such that their vertical position is in strict revision order, so you have a visual cue for the order in which things were done. Where two nodes are in the same column the order is very obvious. When two nodes are in adjacent columns the offset is much smaller because there is no need to prevent the nodes from overlapping, and as a result the order is a little less obvious. Such optimisations are necessary to keep complex graphs to a reasonable size. Please note that this ordering uses the edge of the node on the older side as a reference, i.e. the bottom edge of the node when the graph is shown with oldest node at the bottom. The reference edge is significant because the node shapes are not all the same height.
Because a revision graph is often quite complex, there are a number of features which can be used to tailor the view the way you want it. These are available in the View menu and from the toolbar.
- Group branches
The default behavior (grouping off) has all rows sorted strictly by revision. As a result, long-living branches with sparse commits occupy a whole column for only a few changes and the graph becomes very broad.
This mode groups changes by branch, so that there is no global revision ordering: Consecutive revisions on a branch will be shown in (often) consecutive lines. Sub-branches, however, are arranged in such a way that later branches will be shown in the same column above earlier branches to keep the graph slim. As a result, a given row may contain changes from different revisions.
- Oldest on top
Normally the graph shows the oldest revision at the bottom, and the tree grows upwards. Use this option to grow down from the top instead.
- Jajarkan pohon-pohon di atas
When a graph is broken into several smaller trees, the trees may appear either in natural revision order, or aligned at the bottom of the window, depending on whether you are using the Group Branches option. Use this option to grow all trees down from the top instead.
- Reduce cross lines
This option is normally enabled and avoids showing the graph with a lot of confused crossing lines. However this may also make the layout columns appear in less logical places, for example in a diagonal line rather than a column, and the graph may require a larger area to draw. If this is a problem you can disable the option from the View menu.
- Differential path names
Long path names can take a lot of space and make the node boxes very large. Use this option to show only the changed part of a path, replacing the common part with dots. E.g. if you create a branch
/branches/1.2.x/doc/htmlfrom/trunk/doc/htmlthe branch could be shown in compact form as/branches/1.2.x/..because the last two levels,docandhtml, did not change.- Show all revisions
This does just what you expect and shows every revision where something (in the tree that you are graphing) has changed. For long histories this can produce a truly huge graph.
- Tampilkan revisi-revisi HEAD
This ensures that the latest revision on every branch is always shown on the graph.
- Exact copy sources
When a branch/tag is made, the default behaviour is to show the branch as taken from the last node where a change was made. Strictly speaking this is inaccurate since the branches are often made from the current HEAD rather than a specific revision. So it is possible to show the more correct (but less useful) revision that was used to create the copy. Note that this revision may be younger than the HEAD revision of the source branch.
- Fold tags
When a project has many tags, showing every tag as a separate node on the graph takes a lot of space and obscures the more interesting development branch structure. At the same time you may need to be able to access the tag content easily so that you can compare revisions. This option hides the nodes for tags and shows them instead in the tooltip for the node that they were copied from. A tag icon on the right side of the source node indicates that tags were made. This greatly simplifies the view.
Note that if a tag is itself used as the source for a copy, perhaps a new branch based on a tag, then that tag will be shown as a separate node rather than folded.
- Hide deleted paths
Hides paths which are no longer present at the HEAD revision of the repository, e.g. deleted branches.
If you have selected the Fold tags option then a deleted branch from which tags were taken will still be shown, otherwise the tags would disappear too. The last revision that was tagged will be shown in the colour used for deleted nodes instead of showing a separate deletion revision.
If you select the Hide tags option then these branches will disappear again as they are not needed to show the tags.
- Hide unused branches
Hides branches where no changes were committed to the respective file or sub-folder. This does not necessarily indicate that the branch was not used, just that no changes were made to this part of it.
- Show WC revision
Marks the revision on the graph which corresponds to the update revision of the item you fetched the graph for. If you have just updated, this will be HEAD, but if others have committed changes since your last update your WC may be a few revisions lower down. The node is marked by giving it a bold outline.
- Show WC modifications
If your WC contains local changes, this option draws it as a separate elliptical node, linked back to the node that your WC was last updated to. The default outline colour is red. You may need to refresh the graph using F5 to capture recent changes.
- Filter
Sometimes the revision graph contains more revisions than you want to see. This option opens a dialog which allows you to restrict the range of revisions displayed, and to hide particular paths by name.
If you hide a particular path and that node has child nodes, the children will be shown as a separate tree. If you want to hide all children as well, use the Remove the whole subtree(s) checkbox.
- Tree stripes
Where the graph contains several trees, it is sometimes useful to use alternating colours on the background to help distinguish between trees.
- Show overview
Shows a small picture of the entire graph, with the current view window as a rectangle which you can drag. This allows you to navigate the graph more easily. Note that for very large graphs the overview may become useless due to the extreme zoom factor and will therefore not be shown in such cases.
To make it easier to navigate a large graph, use the overview window. This shows the entire graph in a small window, with the currently displayed portion highlighted. You can drag the highlighted area to change the displayed region.
Tanggal revisi, pembuat dan komentar ditampilkan dalam kotak petunjuk kapan saja mouse melalui kotak revisi.
If you select two revisions (Use Ctrl-left click), you can use the context menu to show the differences between these revisions. You can choose to show differences as at the branch creation points, but usually you will want to show the differences at the branch end points, i.e. at the HEAD revision.
Anda bisa melihat perbedaan sebagai file Unified-Diff, yang menampilkan semua perbedaan dalam file tunggal dengan konteks minimal. Jika Anda memilih ke → Anda akan disodorkan dengan daftar file yang diubah. Klik ganda pada nama file utnuk mengambil kedua revisi dari file dan membandingkannya menggunakan piranti pembeda visual.
Jika Anda mengklik kanan pada revisi Anda bisa menggunakan → untuk melihat histori.
You can also merge changes in the selected revision(s) into a different working copy. A folder selection dialog allows you to choose the working copy to merge into, but after that there is no confirmation dialog, nor any opportunity to try a test merge. It is a good idea to merge into an unmodified working copy so that you can revert the changes if it doesn't work out! This is a useful feature if you want to merge selected revisions from one branch to another.
Learn to Read the Revision Graph
First-time users may be surprised by the fact that the revision graph shows something that does not match the user's mental model. If a revision changes multiple copies or branches of a file or folder, for instance, then there will be multiple nodes for that single revision. It is a good practice to start with the leftmost options in the toolbar and customize the graph step-by-step until it comes close to your mental model.
All filter options try lose as little information as possible. That may cause some nodes to change their color, for instance. Whenever the result is unexpected, undo the last filter operation and try to understand what is special about that particular revision or branch. In most cases, the initially expected outcome of the filter operation would either be inaccurate or misleading.
If you want to check the server again for newer information, you can simply refresh the view using F5. If you are using the log cache (enabled by default), this will check the repository for newer commits and fetch only the new ones. If the log cache was in offline mode, this will also attempt to go back online.
If you are using the log cache and you think the message content or author may have changed, you should use the log dialog to refresh the messages you need. Since the revision graph works from the repository root, we would have to invalidate the entire log cache, and refilling it could take a very long time.
A large tree can be difficult to navigate and sometimes you will want to hide parts of it, or break it down into a forest of smaller trees. If you hover the mouse over the point where a node link enters or leaves the node you will see one or more popup buttons which allow you to do this.

Click on the minus button to collapse the attached sub-tree.

Click on the plus button to expand a collapsed tree. When a tree has been collapsed, this button remains visible to indicate the hidden sub-tree.

Click on the cross button to split the attached sub-tree and show it as a separate tree on the graph.

Click on the circle button to reattach a split tree. When a tree has been split away, this button remains visible to indicate that there is a separate sub-tree.
Click on the graph background for the main context menu, which offers options to Expand all and Join all. If no branch has been collapsed or split, the context menu will not be shown.